
Best Greyhound Betting Sites – Bet on Greyhounds in 2026
Loading...
The Race Starts Before the Traps Open
When the trap draw is published on the racecard, the race has already begun — at least analytically. Which trap a greyhound starts from determines its proximity to the inside rail, its route to the first bend, and its exposure to crowding from neighbouring runners. At some UK tracks, certain traps produce significantly more winners than others over large sample sizes. That’s not luck. That’s geometry, and the racecard hands you the data to account for it.
Trap draw analysis sits at the intersection of track knowledge and form reading. A dog’s CalcTm tells you how fast it can run. Its sectional time tells you how quickly it breaks. But neither figure accounts for where the dog starts on the track. A fast breaker drawn in trap 1 at a track with a short run to the first bend is in a fundamentally different position from the same dog drawn in trap 4. The form is identical. The context isn’t. Understanding how trap position interacts with track geometry is what turns a racecard number into a race-day probability.
Why Some Traps Win More Than Others
UK greyhound tracks are left-handed ovals. The first bend is a left turn, which means dogs on the inside rail — traps 1 and 2 — have the shortest distance to travel to reach the bend. Dogs on the outside — traps 5 and 6 — travel a wider arc. In theory, the inside traps should hold a permanent advantage. In practice, the picture is more nuanced, because the advantage of the rail depends on what happens in the first few seconds of the race. Track-specific trap statistics are published by services like Timeform and the Racing Post.
The critical variable is the run-up distance: the length of the straight between the starting traps and the first bend. Tracks with a short run-up compress the field quickly. Dogs barely reach full speed before they’re into the turn, and the inside traps benefit disproportionately because there’s no time for outside runners to establish position. At these tracks — Romford’s sprint course is a classic example — trap 1 statistics often show a win rate well above the expected 16.7% baseline.
Tracks with a longer run-up distribute the advantage more evenly. When dogs have 80 or 100 metres of straight before the first bend, even outside runners have time to build speed and find racing room. The inside rail still offers the shortest route, but the gap in advantage between trap 1 and trap 6 narrows. At some longer-run tracks, trap 6 actually outperforms the middle traps, because the outside runner has clear space and doesn’t get caught in the traffic that forms when the field converges at the bend.
The middle traps — 3 and 4 — consistently underperform at most UK tracks. Dogs starting from the centre of the pack have no geometric advantage. They’re flanked on both sides, and when the field bunches at the first bend, they’re the most likely to encounter crowding. Form remarks like “Crd1” and “Bmp1” (crowded or bumped at the first bend) appear disproportionately against middle-trap runners. This isn’t a judgment on the dogs’ ability — it’s a consequence of where they start.
Track-Specific Trap Statistics
Trap bias varies significantly between tracks, and serious bettors build track-specific knowledge over time. The major racecard services — Timeform, the Racing Post, and specialist greyhound data sites — publish trap statistics broken down by track and distance. These figures show win percentages and place percentages for each trap number over rolling periods, typically the last six or twelve months of racing.
At Romford, for instance, trap 1 at the sprint distance historically wins at a rate above 20% — roughly four percentage points above the random baseline. Trap 6, despite its outside position, often shows the second-best win rate, reflecting the clear outside run that Romford’s track geometry provides. Traps 3 and 4 typically sit below 15%. These are aggregate figures over hundreds of races, and they’re statistically robust enough to inform racecard analysis.
At a track like Nottingham, where the configuration is different, the trap bias pattern shifts. The run-up distance, the bend radii, and the straight length all differ, producing a different distribution of advantage. A bettor who applies Romford trap statistics to a Nottingham card is using the wrong map. Each track requires its own baseline, built from its own data.
Distance matters within the same track as well. The sprint distance at a venue may have different trap statistics from the standard distance, because the starting position relative to the first bend changes. A trap that’s advantageous over 280m might be neutral over 480m at the same track, simply because the traps are positioned differently on the circuit. When checking trap statistics, filter by both track and distance — the combination is what matters.
Seasonal variation is worth noting too. Sand tracks ride differently in winter and summer, and the going can affect which part of the track runs fastest. A rail that favours trap 1 in dry summer conditions might lose its edge when the sand is heavy with winter rain and the inside line becomes slower. These shifts are subtle and don’t always show up in aggregate annual statistics, but they’re visible if you track results meeting by meeting during transitional weather.
Using Draw Data in Your Racecard Analysis
Trap draw analysis isn’t a standalone system. It works as a filter applied on top of form data. The process follows a logical sequence: first, assess each dog on CalcTm, sectional time, grade, and form trajectory. Then, overlay the trap draw to see whether the starting position supports or undermines the form assessment.
A dog with the best CalcTm in the field, drawn in the statistically strongest trap at that track and distance, has form and geometry aligned. That alignment increases confidence. The same dog drawn in the weakest trap still has the best form, but the starting position introduces a friction that the CalcTm alone doesn’t capture. It might need to cross traffic to find its preferred running line. It might get bumped at the first bend. The form hasn’t changed, but the probability of a clean run has decreased.
This filter is particularly useful in separating closely matched dogs. When two runners have similar CalcTms and comparable sectional times, the trap draw can be the tiebreaker. If one is drawn in trap 1 at a track with strong inside bias and the other is in trap 3, the inside-drawn dog has a structural edge that the form data doesn’t differentiate. In tight fields, these margins are where bets are won and lost.
Running style amplifies the draw effect. A confirmed railer drawn in trap 1 has perfect alignment — its natural instinct and its starting position both point to the inside rail. A railer drawn in trap 5 has to work across the field to find its preferred line, which costs time and invites interference. Wide runners show the reverse pattern. Cross-referencing running style (visible in the form remarks) with trap number produces a compatibility score that no single column on the racecard provides on its own.
The Draw Is the Stage, Not the Script
Trap draw data tells you about the conditions under which the race will unfold. It doesn’t tell you who wins. A dog drawn in the best trap at the track can still lose if its form is inferior, its fitness is declining, or the going doesn’t suit. A dog drawn in the worst trap can still win if it’s substantially the fastest animal in the race and breaks cleanly enough to overcome the positional disadvantage.
What the draw does is adjust probabilities at the margins. In a closely matched six-dog field, those marginal adjustments are often the difference between a winning selection and a near-miss. The racecard gives you the form. The trap number tells you where that form will be tested. Read both, and you’re working with a fuller picture of the race than either one provides alone.
Find more race analysis at greyhoundracingcards.
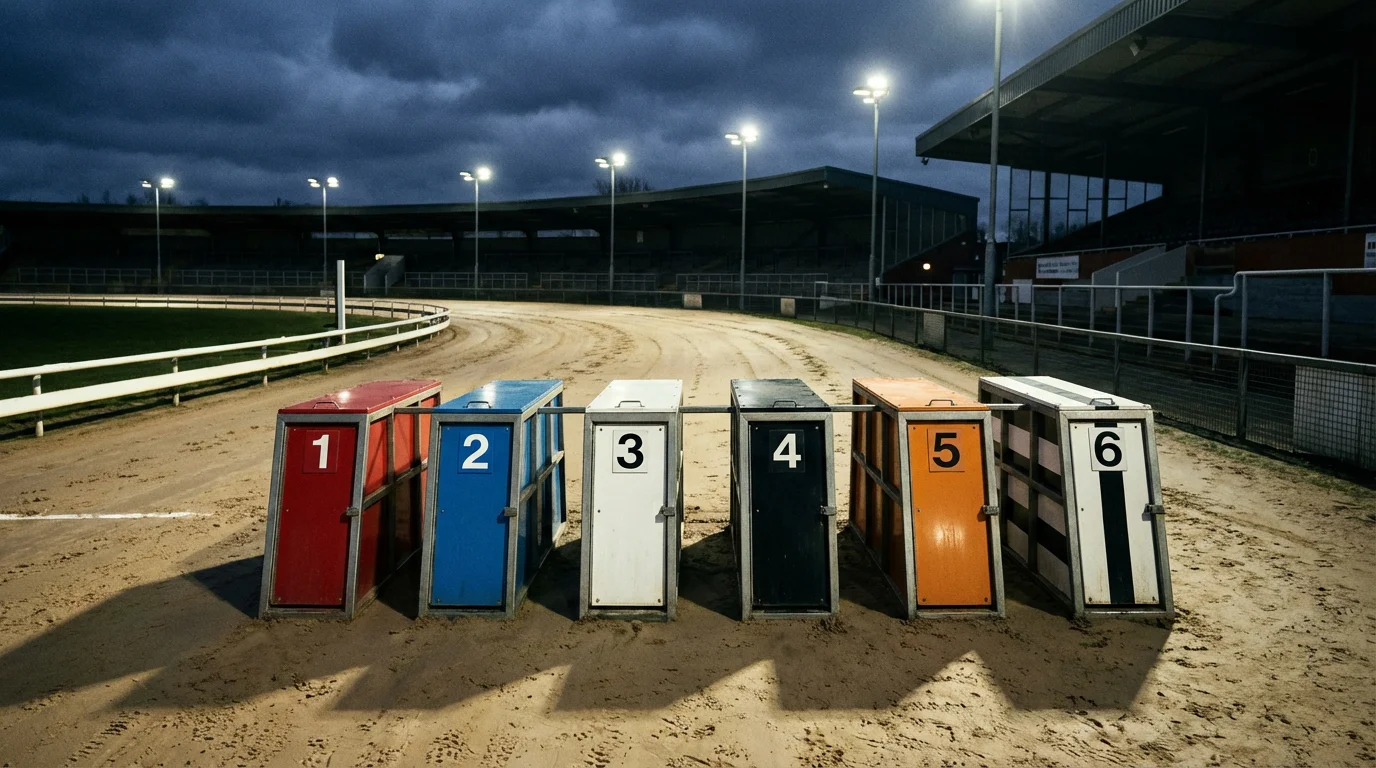
Also read our trap numbers and colours.